It’s been about a year since I wrote a commentary expanding on the analysis contained in the GF Data quarterly reports. The hiatus brings to mind Albert Einstein’s supposed explanation for why he did not speak until the age of four: “Until now everything was fine.”
By that, I mean that the market dynamics described a year ago have remained settled and well observed. Data from the 200-plus GF Data PE contributors confirm that valuations have stayed at historic highs within the swath of market we cover ($10-250 million TEV), with an accommodating debt market driving equity pricing. Larger deals have been bid up more than smaller deals, in part because they continue to receive unprecedented debt support.
Like other deal professionals, acquirers and capital providers, we have the impression that in this extended seller’s market, some businesses are being valued in excess of normalized ranges. We decided to put this impression to the test by digging into the data behind our most recent report, which covers transactions completed as of June 30, 2016. Regular readers know that we measure and report on a quality premium – the spread in valuation between businesses with above-financial characteristics and other firms acquired by financial buyers. We invariably note that this is not a spread between good and bad businesses – all of these firms made it to closing with presumably sophisticated acquirers. Rather, it is a differential between “A” and “B” properties.
Many of us would guess that if any group is benefitting from accommodating conditions, it would be those close to the line of demarcation – solid businesses being bid up by buyers eager to put capital to work and unable to find targets stellar in every respect. So, we decided to isolate these “B+” businesses and see if they are being valued more highly now than in the past.
The Takeaways
Based on the analysis that follows, we conclude that some B+ businesses are being bid up. In particular, buyers are seeing their way clear to premium pricing on businesses offering size and strong margins, but not overpowering growth.
As many of us have learned and re-learned, growth rate is important, but vulnerable to material change both prior to and after a change-of-control transaction. Margins of course can also degrade, but tend to be seen as a more intrinsic characteristic of a given company’s financial model. Thus, margin emerges as the sine qua non in premium valuation.
This dynamic is mainly evident on deals in the $50-250 million value range – companies large enough to attract interest from BDCs and other active debt providers.
Smaller selling businesses are also benefitting from upward pricing pressure, but in that cohort, it is not concentrated in the higher performing firms. We looked at a data set defined by valuation multiple rather than financial metrics. That exercise lends support to the “war stories” one hears these days about fairly pedestrian businesses with three, four, five million in EBITDA trading at lofty multiples.
The Test
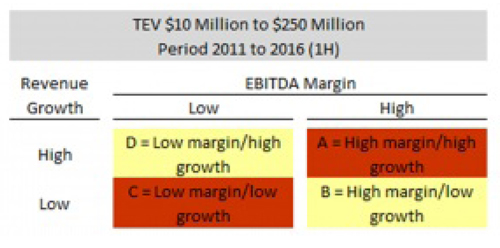
The GF Data universe includes 1,156 buyout transactions (e.g., excluding leverage recaps or growth capital investments) completed since January 1, 2011. About 49 percent – 568 deals – have been tagged as above- average financial performers. Within this group, median TTM EBITDA margin is 15.5%. Median TTM revenue growth is 15.6%. Using these parameters we then cut the 568 above-average businesses into the four sub-groups show below.
The Analysis
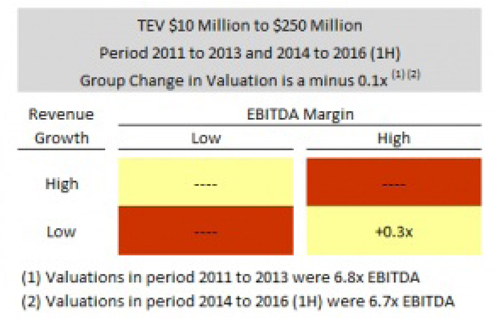
Over the two periods, overall valuations rose slightly, from 6.7x to 6.8x. As the chart below shows, the only group to record an increase was category B – deals featuring above-median EBITDA margins and below-margin growth.
The nature of the businesses being rewarded becomes even more clear when the data is cut by transaction size.
Here are the values for deals in the $10-50 mm TEV range:
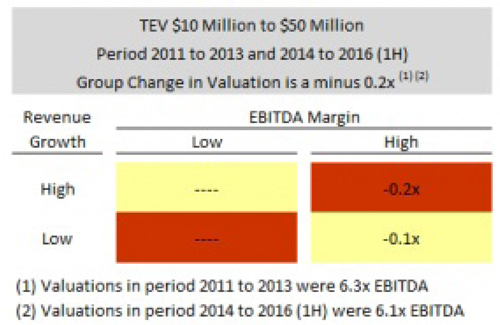
Overall valuations increased from 7.7x in 2011-13 to 7.9x in 2014-2016 1H. Average values in Category B jumped 0.4x, accounting for virtually all of the pickup:
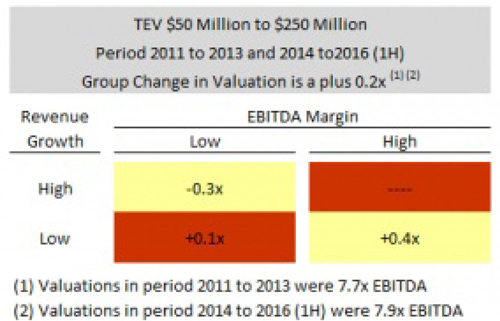
This data also shows that among these above-average performers, margin and growth are not rewarded equally. For the 2011-2016 period, the average mark for companies above the median in margin and below median in growth was 7.9x. For those below the median in margin but above median in growth, the average was in the mid- fives.
We then flipped the inquiry around. Rather than checking multiples for businesses within given financial parameters, we set a valuation threshold and solved for the financial characteristics of companies clearing the threshold.
This data set includes 202 transactions completed since 2011 at multiples of at least 8.0x.
In 2011-13, about 25 percent of the deals in the $10-50 mm TEV tier featured companies with sales growth and EBITDA margins both below 15 percent. For business in the $50-250 mm bracket, 16 percent fell below these hurdles.
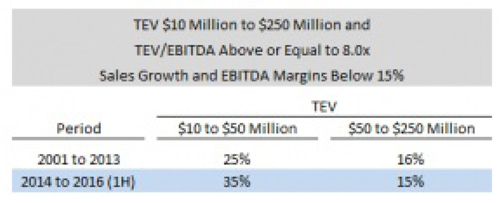
In 2014-16 1H, the incidence of larger deals with lower financial metrics remained virtually unchanged at 15%. Among smaller deals, the percentage jumped to 35%, meaning a greater share of highly valued businesses were getting there with below-median headline metrics.
Whether acquirers are basing their pricing on confidence in their own abilities to achieve growth, the likelihood of less pricey add-on acquisitions, or reduced return expectations, market conditions are shielding some sellers from the haircut traditionally imposed for a record of modest growth on their own watch.
At valuations in excess of $50 million, this trend is concentrated among otherwise attractive businesses. Below that threshold, the imbalance of supply and demand is enriching a more varied mix of sellers.
About the Author
 Andy Greenberg is CEO of GF Data(c) and Managing Director of Fairmount Partners, an M&A firm. Both are based in West Conshohocken, PA.
GF Data is the leading providing of valuation, volume, leverage and key deal term information on private transactions in the $10 to $250 million value range. All charts and data subject to the GF Data terms of use. For more information, visit www.gfdata.com.
Article Footnotes:
- GF Data defines better financial performers as businesses with TTM EBITDA margin and revenue growth rates above 10 percent, or one above 12 percent and the other metric at least eight percent. Outliers on the high side are excluded and occasional discretion is applied in ruling firms in or out.
- It’s understood that margin and growth rate are meaningful, but only two of many considerations that go into the assessment or valuation of a private business. We focus on them here because they are fairly generalizable, but want to caution that conclusions applied to the broader market are probably not as readily applicable to an individual business.
- GF Data caps multiples on the high end at 15x. Deals with negative revenue growth also were excluded.
“GF Data is one of the only data sources that can provide our clients with valuation data specific to the size of their business from the perspective of financial buyers.”
—Jeremy Ellis, Genesis Capital
“GF Data reports on what financial buyers are really paying for middle market companies. They also provide valuable data on leverage, pricing, and terms and conditions. There is no other reliable source for this type of data.”
—Ronald Miller, President and Managing Director, Cleary Gull Inc.
“As the leading underwriter of public capital in the BDC sector, we rely on GF Data to give us a competitive edge and keep us current on leverage and valuation levels.”
—Joe Culley, Head of Capital Markets, Janney Montgomery Scott